🧮 Visidata
Visidata for slicing, dicing, analyzing and displaying your tabular data from the CLI. With support for many data sources and output formats, it's a true data multi-tool.

Like to use spreadsheets and manage tabular data from the CLI? Visidata (code) is the tool for you.
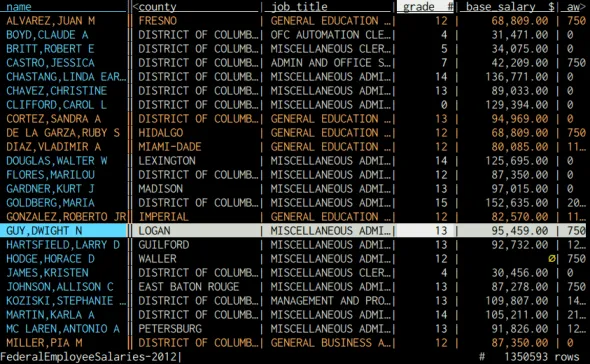
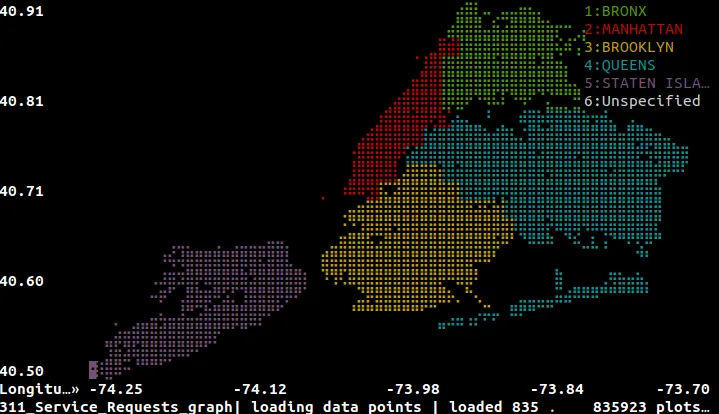
With support for a wide variety of input data (CSV, Excel, Numpy, SQLite DBs, Pandas data frames), and the need to convert your data into JSON/YAML, a graph, or simply view it in the terminal, VisiData is a multi-tool you'll love.
Visidata is a multi-tool – this means it's very flexible and can do much more than the use-cases above on a wide variety of input and output formats. To fully use this tool, it's best to read some tutorials:
Visidata also has some case studies you can watch:
Visidata's documentation is excellent, so of course, that's a great place to start. Visidata is the kind of high quality F/OSS that pays off when you invest in it.
Running VisiData
Since VisiData is a command line tool all you need to do is install it. It's available via a wide variety of sources:
- PYthon Package Index (PYPI) via
pip3 install visidata - Homebrew on Mac OS via
vrew install saulpw/vd/visidata - Arch via
pacman -S visidata - Debian via
apt install visidata